Ethnic Politics in Changing Flushing
|
New York State Assembly- District 22: The Candidates • Ellen Young, former district administrator (D). Other Races • New York State Assembly- District 57: Succeeding Green in Fort Greene – and Beyond • New York State Senate-District 13: Bringing the Money Back from Albany |
When Jimmy Meng became the state assembly's first Chinese American member in 2004, many people credited ethnic appeal in an increasingly Asian district. Meng, suffering from chronic back pain, has decided against running for re-election. The ethnic politics of the Queens district will likely come into play again as three candidates vie for his seat.
Three candidates are running for the Democratic primary. Ellen Young, worked for Councilmember John Liu before stepping down to campaign. Julia Harrison, who held Liu's seat in the council before stepping down due to term limits. Terence Park, a district leader, and member of Community Board Seven, was removed from the ballot for a technicality but successfully appealed, reversing the decision. Young is Chinese, Harrison is white, and Park is Korean.
Meng's daughter, Grace Meng, also attempted to run for the seat, but was removed from the ballot after it was determined she did not live in the district. Young has raised about $250,000, and Terence Park has raised $219,000, while Harrison has raised $32,000. The primary winner will face Republican candidate Christopher Migliaccio in November.
ETHNIC POLITICS
Young and Harrison insist that race is not an issue in the campaign. But some frame the election as a contest between the old, mainly white Flushing represented by Harrison, and the changing, more racially diverse community represented by the Asian candidates. Fifty-one percent of the district's residents are Asian.
"It is very obvious and very honest to say that race is a factor … but real voters care for what your record is about," said Park.
Young is considered an immigrant advocate, and has served as the president of the Chinese American Voters Association, and has organized programs to help immigrants fill out Census forms. Harrison and Park, meanwhile, say immigration issues should be left to the federal government. Harrison has questioned the very practice of categorizing people as immigrants, and says that as long as they are citizens she would represent them like any other constituent.
Harrison's comments about immigrants have led to trouble in the past. In 1996 she was criticized for making derogatory comments about Asian Americans when she was quoted saying they "were more like colonizers than immigrants. The money came first. The paupers followed, smuggled in and bilked by their own kind." She maintains that her words were misconstrued.
Harrison has said the Democratic Club of Flushing, Whitestone and College Point asked her to run because it felt that the other Democratic candidates were running on personal and racial appeal, but lacked legitimate experience. Young maintains that her two-decade record of public service is more than adequate experience.
SIMILAR PHILOSOPHIES, DIFFERENT FOCUSES
Candidates have largely focused on relatively uncontroversial issues, such as an increased police force, more funding for schools, and better transportation. The candidates did, however, have different plans for how to best achieve common goals such as safer streets. Young, Park, and Harrison mentioned increased police presence to fight crime, while Migliaccio focused on stronger penalties to deter crime.
Park focuses on overdevelopment, saying that plans for downtown Flushing could bring "chaos to our community" if better planning for parking is not taken into consideration. He also worries that the character of the neighborhood is threatened by increasingly dense residential construction projects.
"There are too many developers invading our neighborhoods and knocking down houses to build multiple dwelling houses," he said.
In regard to education, the candidates agreed upon the need for increased funding for public schools and increased hours for after school programs. Migliaccio, however, differed from the Democratic candidates in emphasizing the need to give students the means to obtain education out of district, instead of limiting educational funds to improvements within the district.
Transportation was also a frequently mentioned issue. Migliaccio and Harrison emphasized the importance of extending the 7 subway line to reach farther into Queens. This would better connect various neighborhoods of Queens to one another, as well as giving residents of the farther bounds of the district better access to Manhattan.
One area of contention, however, has been that of health care. While Young and Harrison spoke of improving Medicare and Medicaid, Migliaccio disagreed. “I don’t think the state should be the primary provider,” he said. “That’s not our job.”
Â
The Way in San Jose
|
Taking the Public Pulse |
San Jose is the third largest city in California, larger than San Francisco, larger than Oakland. We have a $2.7 billion combined budget, about 6,700 employees, 27 departments and offices, 10 council members elected by district and a mayor elected at large.
We deliver services. We are not just a group of people who get together to drink coffee or stand around a hole in the street and take home nice salaries and good benefits.
The customers only see the results of what we do. They may see us standing around the hole, but then they have to drive across the field once the hole is filled in. That’s what most people see: how the hole is filled in, if the street is smooth or not.
Surveys are very different from normal ways that we receive information, policy desires and even service requests.
In the survey, many of the people who give us information are not registered voters or likely voters. They are probably not the people who show up at meetings. They are not the people who get together in a neighborhood association. Some of them are probably not even citizens. We actually don’t call it a citizen survey; we call it a community survey because almost half of the respondents in some of our neighborhoods are probably not citizens.
We do the survey every two years on the telephone in English, Spanish and Vietnamese. A hundred questions. That selects out certain people right there; you have to have 20 minutes to spend.
It covers issues. What’s the major issue for San Jose? What’s the condition of your neighborhood, what’s the condition of the streets?
Half of these questions relate directly to performance measures. Others are, “What do you see as the major issue? What would you like done?” That sort of thing. We ask if people volunteer and a bit about demographics. And finally we do a couple of research questions.
Our report is done by a survey consultant, who is a pollster. It is under the direction of the city manager. We feel, of course, that it is balanced, fair and honest.
The survey got us the first positive headline in a while on the front page of the Mercury News. It said that San Jose “was a good place to live.” Seventy-nine percent of the people thought the quality of life was good, up four percent since 2000. Seventy-six percent were satisfied with services. Eighty percent were happy with our employees.
A couple of survey questions that were new this year were surprises. We asked people “How do you want to get services or find information that’s not emergency in nature?” People want to call a person. They don’t want to go to a Web site, they don’t want to go to a call center. That surprised me because I think the 311 system is a great gateway and having a good Internet page will be a gateway of the future. But it’s clear that, even in the capital of Silicone Valley, we are not quite there.
We have learned some lessons. There are multiple voices in government. You don’t have just one customer who pays. You have customers who don’t even use the service, but who care as well.
Brooke Myhre is with the budget office of the City of San Jose, California.
Â
Hitting the 9 Million Mark
New York City’s population will reach 9 million around 2025, according to a spate of demographic projections featured in various news stories. But will the city really hit the 9 million mark in the next 20 to 25 years, as Con Edison, researchers for the Metropolitan Transportation Council, and Deputy Mayor Daniel Doctoroff predict?
The answer is a resounding yes, if one accepts the underlying assumptions of such projections. But since, like all projections, these estimates seek to predict the future, we will not be able to judge their accuracy for many years to come.
To get a sense of their accuracy though, we can compare projections with recent estimates and with patterns of historical growth. Urbanomics has produced one of several such studies projecting 9 million New Yorkers. To arrive at that number, it expects a growth rate in New York City higher than the rate between 1940 and 2000 and well in excess of what has occurred since 2000, as estimated by the U.S. Census Bureau.
Estimating New York City
The census estimates of New York City's population in the 1990s vastly underestimated the city's growth. (See Gotham Gazette.) Since 2000, however the bureau changed its procedures. It is instituting a new American Community Survey to provide a yearly census update. Along with records of births, deaths, and internal migration from the Internal Revenue Service data, that survey tracks the foreign born population. The first full release of the survey is due at the end of August and could change the picture of the city’s current and projected growth.
But the figures now available indicate that, since 2000, the estimated growth rate varied from a high of 0.718 percent between 2000 and 2001 to a small loss in population between 2004 and 2005. On average, the estimated growth rate since 2000 has been 0.353 percent. (These figures are summarized in Table 1.) Now many theorize that the growth rate has surely slowed, a consequence, they believe, of a slight ebbing in immigration, the end of the stock market boom, and the shock of 9/11.
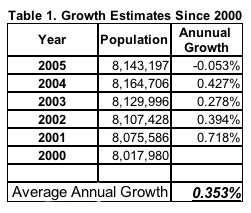
But despite all that Urbanomics projects a much higher growth rate of 0.564 percent for the 30 years through 2030. Since the city’s population increase for the first five years of that period has already failed to reach that level, New York City’s growth must rise in the next few years if Urbanomics and its colleagues are to turn out to be correct.
A Century of Population Growth
New York has been the largest city in the country since 1790. (Since the consolidation of the city in 1897, the city population includes all five boroughs.) Table 2 shows the census population for each decade from 1900 through 2000, the percent change from the previous census, and the annual growth rate (compounded).
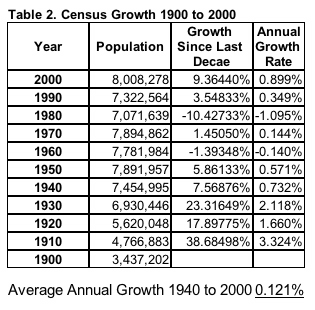
The decades from 1900 through 1930 were years of explosive growth. In many ways, New York City was the Sunbelt of the 1910s and 1920s, with its population more than doubling from 1900to 1930.
But to evaluate the new projections, the decades from 1940 through 2000 are especially relevant, since by 1940 much of New York City's transportation infrastructure was completed, the vast bulk of its road network already existed, and many buildings still in use had been erected. In short, New York City looked much like it does today in many ways.
As the data make plain, New York City was very near the 8 million mark twice -- 1950 and 1970 -- but in both instances the city then lost people. Indeed the population was officially at little more than 7.3 million in 1990. Economic downturn, white flight and the slowing of immigration until the 1980s led to New York City's slow growth until the last decade of the 20th century.
Then, quite unexpectedly, the population reached 8 million in 2000, spurred largely by the city's economic rebound and the robust increase in immigration.
Some of the apparent growth from 1990 to 2000 was simply the result of better counting in 2000. The difficulties and uncertainties in counting New York City's population led to a substantial undercount in 1990.
Despite all this, though, during the whole period from 1940 through 2000 the average growth rate (compounded) was 1.21 percent, less than one-quarter of the optimistic rate projected by Urbanomics and similar prognosticators for the next 30 years.
Assuming and Projecting
The latest high growth projections imply a population growth rate that vastly outstrips the historic growth patterns in New York City from 1940, as well as the recent brisk growth estimated since 2000. Small differences in a rate of growth for one year, when compounded, result in very large differences in projections.
If New York City grew during the 30 years after 2000 at the rate it averaged from 1940 to 2000, including that period’s booms as well as its two population declines, the population by 2030 would be about 8.3 million. If the average growth for the 30 years starting in 2000 matches the recent census estimates, New York City will almost reach 8.9 million by 2030. But the Urbanomics estimate expects an average growth rate of 0.564 percent through 2030 resulting in almost 9.5 million New Yorkers.
So, in predicting the future, it depends on how one views the past and the present. Historical population trends would seem to imply very little growth in population between now and 2030. A continuation of recent trends would imply somewhat more growth. And relying on a series of economic assumptions could put New York City's population at about 9.5 million by then.
Framed this way, it seems it could well take considerably more time than Urbanomics and others predict for New York City's 8 million to become 9 million. But only the future will tell for sure.
Andrew A. Beveridge has taught sociology at Queens College since 1981, done demographic analyses for the New York Times since 1993, and been in charge of Gotham Gazette's demographics topic page since 2000. The opinions expressed are his alone.Â
New York's Asians
Who are the Asians of New York City? They are foreign-born and native-born New Yorkers with a background in East Asia (China and Japan, for example), Southeast Asia (Vietnam, Thailand, Cambodia), and South Asia (India, Pakistan and Bangladesh), according to the official U.S. government classification of the Asian race. (Those from Central Asia -- Afghanistan, Iraq, Turkey, etc. -- are not included.) Members of these diverse populations now constitute about 11 percent of the city's population.
But can one really consider as one race people coming from several continents and speaking many different languages?

It should not be surprising that Asian groups vary greatly from one another.
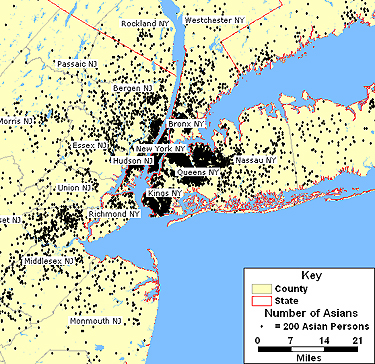
Taken as a whole, though, there are some generalizations that can be made based on recent census data. The vast bulk of Asians in the metro area live in or near New York City, as the accompanying map shows. In fact, over half of all Asians in the tri-state area live in the city.
Asian households also have higher median household income than any other of the main racial groups except for whites.

But there are sharp differences as well. The command of the English language varies greatly by group. Only about 38 percent of Bangladeshi speak English well, while over 80 percent of Filipinos do. The proportion of those over 25 years of age who have a BA degree also varies greatly, from a low of 9.1 percent for the Laotians, to a high of 74.4 percent for the Taiwanese. The proportion holding a professional and managerial job varied from 8.4 percent for Laotian and 17.2 percent for Bangladeshi to over 66 percent for the Taiwanese. The percent self-employed also varied greatly, with Koreans in the lead with 18 percent. In terms of wages the Taiwanese and Japanese had median wages of $50,000, while the Bangladeshi had only $20,000. Other groups were also quite low including: Thai, Vietnamese, Maylaysian and Indonesian. Household income also varied greatly among the Asian groups. Figures for the Filipino was $73,000, while Japanese, Asian Indian, Cambodian, Taiwanese and Sri Lankan were all at least $60,000. However, Bangladeshi, Maylaysian, Indonesian and Asian not-specified all report median household incomes less than $40,000.

Growth of the Asian groups in the New York area has been dramatic for the last several decades. Though growth since the 2000 Census is not reported for the various Asian groups in a reliable way, the pattern of growth shown in the accompanying figures likely has continued.
The charts show a dramatic increase in Chinese (which includes mainland, Taiwanese and other Chinese), and in Asian Indian, which includes Pakistani, Bangladeshi and Indians, as well as in the Filipino population. The growth of Korean and other groups though marked is not as strong.


Andrew A. Beveridge has taught sociology at Queens College since 1981, done demographic analyses for the New York Times since 1993, and been in charge of Gotham Gazette's demographics topic page since 2000. The opinions expressed are his alone.Â
Undocumented Immigrants
New York City certainly has a lot at stake in the current debate in Congress over the most significant change in immigration policy in decades. More than a third of all New Yorkers are foreign-born. In the year 2000, New York was home to some 2.8 million immigrants, which is more than nine percent of all immigrants in the United States.
But if neither the pro-immigrant demonstrations nor the anti-immigrant rhetoric has ratcheted up here the way it has elsewhere in the country, there are solid reasons for this. The situation is very different in New York City than it is in California and the Southwest.
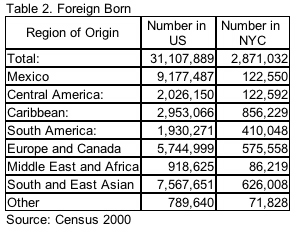
One difference is that the countries of origin in New York City are far more diverse than in other centers of immigration, as I wrote for this page in an article in 2002, "City of the Foreign Born." In Los Angeles, Mexicans account for almost 85 percent of the foreign born. No group in New York City is greater than 13 percent. So the protests in Los Angeles are largely that of one group. "The mobilization in New York City has been slower to develop," El Diario conceded recently. "The immigrant community here is incredibly diverse and, some say, harder to organize."
But the major difference may well be size and visibility of the undocumented. As of 2005, there are estimated to be 652,000 immigrants living illegally in New York City, which constitutes only about six percent of all of the undocumented in the United States. New York City's undocumented immigrants, as its legal immigrants, come from all continents and many countries of origin.
Jeffery Passel, a a leading analyst of immigrants, recently looked at the population of undocumented immigrants for a study by the Pew Hispanic Center. This study uses the so-called residual methodology, which makes it difficult to infer very much about the undocumented except their size. The study estimates that the number of undocumented immigrants in the United States may be 12 million by March 2006, and that they constitute about 30 percent of all immigrants nationwide. In New York City, the undocumented comprise only about 20 percent of all the immigrants here.
Two main groups of undocumented are those who entered the country without valid documents, including people crossing the Southwestern border clandestinely; and those who entered with valid visas but overstayed their visas' expiration or otherwise violated the terms of their admission. Most of New York City's undocumented belong to the latter category.
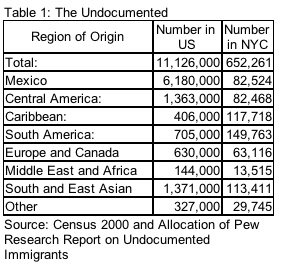
About 56 percent of unauthorized migrants in the United States come from Mexico. Another 22 percent of the total, come from the rest of Latin America, primarily from Central America. Between 2000 and 2005 the number of unauthorized migrants from Mexico increased by about 1.5 million. Other large increases occurred among unauthorized migrants from Central America (+465,000) and South and East Asia (+365,000).
New York City has many Asian immigrants. But, while the numbers are surely growing, there are still relatively few Mexicans or Central Americans here, compared to the West Coast.
The undocumented are more likely male. Many live in families and nearly two-thirds of their children were born in the United States and are citizens. Unauthorized workers are employed in a variety of occupations, although the distribution of the unauthorized workforce across occupations differs from that of native-born workers. For example, nearly a third of unauthorized workers were employed in service occupations compared to one-sixth of native workers. Unauthorized migrants are underrepresented in white-collar occupations. These facts are true of undocumented in New York City and throughout the United States.
Given the demographics of New York City, and its long-time political traditions, it seems likely that most New Yorkers will remain well disposed towards the city's immigrants, legal or illegal.
Andrew A. Beveridge has taught sociology at Queens College since 1981, done demographic analyses for the New York Times since 1993, and been in charge of Gotham Gazette's demographics topic page since 2000. The opinions expressed are his alone.Â
Transit Workers/Transit Riders; Beginning Lawyers Are Richer; 9 Million New Yorkers?
More than two months after the end of the three-day New York City transit strike, both the attention and the tension have dimmed. But there is still no settlement in place, and indeed some transit workers have signed a petition to vote again on the contract that had been rejected on January 20th by a mere seven votes.
It would be difficult to say with whom the majority of New York bus and subway riders sided, the transit workers or the management of the Metropolitan Transportation Authority. It is a safe bet to say that during the inconvenience of the strike itself, most commuters had little polite to say about either of them.
Since people tend to sympathize with those who seem similar, it is worth looking at the ways in which transit workers resemble, and differ from, transit riders.
Transit Riders
New York City is one of the few places in the United States in which only a minority of people rely on the automobile to get to work. Nationwide, 86 percent of people who live in or near central cities commute by car. In New York City, that number is about 33 percent.
Table 1 offers a breakdown:

It is interesting to note that public transit workers in New York actually commute by automobile at a higher rate than New Yorkers as a whole.
There are also sharp demographic differences among commuters, depending on the means by which they get to work. For instance, those who use commuter rail to come to NYC generally earn more income, live in more affluent households, are more often male, are more likely white, are more often living with a spouse and have graduated from college than those using other means to get to work. They differ substantially from those who drive or ride an automobile, work at home or get to work by other means.

By contrast, those who take public transit are more likely to be black and Hispanic than the other groups. They are less likely to be living with a spouse. They are also likely to have less education. The median income of those using public transit (subway or bus) is about $34,000.
Transit Workers
Public transit workers make a median income that is more than the public they service. Instead of $34,000, they earn a median income of $47,000.
There are other differences as well. A larger fraction of transit workers are male and black than the public at large. They are also less likely to be educated, are as a group older than New Yorkers as a whole, and are more likely to own their own homes and live in married-couple households. Despite their relative lack of education, the arduous nature of transit work coupled with their unionized power has led them to a relatively high income.

How this analysis was done.
This analysis made use of the Public Use Micro-sample data from the IPUMS website. Using a variety of variables it was possible to isolate those who work in the public or private transit industry, as well as those who work in New York City and travel to their jobs in various ways.
Young Lawyers Get $20,000 raises
According to New York Observer, a bidding war has broken out among the major so-called Wall Street or White Shoe law firms. New associates are now being offered $145,000 up from $125,000, where it has been for about 5 years. My earlier column on New York Lawyers still seems to be basically accurate, though the figures have increased.
Nine Million New Yorkers?
Is New York growing so fast that it is likely to reach 9 million population in the next two decades? Using recent projections from some private entities a New York Times story indicates that the Bloomberg administration is planning for it. New York City reached over seven million by 1940 and it took 60 years to reach eight million. Could it really reach nine million by 2025? So far, according to census numbers, New York City is growing more modestly than it did in the 1990s. The census recently changed their estimation methods, but the city usually challenges their estimates and is given credit for a few more thousand people. During that decade the census estimated that the city was only growing about 10,000 per year, but it actually was growing about 60,000. We will probably know more when the new fully implemented American Community Study data are released next August. Until then, the Census will issue a new estimate for the population through July 31, 2005 sometime this spring.
Census Says Keep Counting the Prisoners in Prison
Despite the efforts of many in the redistricting and criminal justice communities the Census Bureau says that prisoners should still be counted at the prison sites and that the data should continue to be added to the counts in many small towns and counties. A rider was added to the census appropriation bill asking for a report on this issue. Not surprisingly the Census Bureau did not want to change a thing. The current method deprived the city of thousands of residents, who were moved upstate along with their power to affect the drawing of legislative lines for Congress, and State Senate and Assembly. But at least one New York State County does not use prisoners when they draw the county legislative lines, they think they distort the power in that county.
Andrew A. Beveridge has taught sociology at Queens College since 1981, done demographic analyses for the New York Times since 1993, and been in charge of Gotham Gazette's demographics topic page since 2000. The opinions expressed are his alone.Â
Teachers In NYC's Institutions Of Higher Learning
Although few people would see New York City as a college town, the truth is that the city has the most institutions of higher learning in the entire nation, as well as the most students -- and the most teachers as well. At least 25,000 academics teach about 425,000 students in the city's 57 colleges and universities.
These teachers do much for the city, not just educating the next generation of New Yorkers, but also enhancing the city's cultural reputation and strengthening its economy.
But what does the city do for them? As a whole, teachers of higher learning in New York earn less than the city's elementary school teachers. This helps explain some of the current turmoil in academia, with a strike by graduate students having resumed at New York University, and stalled contract negotiations between the administration of the City University of New York and the Professional Staff Congress, the 20,000-member union that represents the faculty and staff of the university.
It Doesn’t Pay To Be An Academic
Table 1 (click here) lists most of the institutions of higher learning in New York City, with the numbers of students enrolled, the number of faculty, and their average salary. This varies widely. As a full professor at New York University, you could make $135,000; as an assistant professor at Boricua College, you could make under $35,000. But the truth is, more teachers make toward the lower end than toward the higher. The median income for full-time professors with at least a Master's degree is $57,000 – which is $3,000 less than the median income for all New Yorkers with Master's degrees.
And this is only the full-time faculty; there are no more than 16,000 people who teach full-time in New York at the university level. Another 11,000 who call academia their primary occupation nevertheless teach only part-time; their median income is only $22,000.
Put these two together and the median earnings in the year 2000 of New Yorkers whose primary occupation was academia (and who had at least a Master's degree) was $45,000 – or a thousand dollars less than the median income for elementary and secondary school teachers in the city.

And then there are the many academics who are forced to accept "adjunct positions," which often pay roughly $3,000 per course, or "visiting" (non-permanent) appointments, which also usually are not well paid. (Many of these teachers hold non-academic jobs as well.) In addition, many graduate students do some teaching while pursuing their degrees.
Public Versus Private
There are a wide variety of colleges and schools in New York City. Below, the "conventional" colleges are grouped into four types – City University senior colleges, City University community colleges, private colleges and religious-affiliated colleges – for the purposes of comparing both the number of faculty at each of these types of institutions, and their salaries.

As you can see above, both private and religiously-affiliated institutions of higher learning have overtaken the public university in many ways. While once salaries for full professors (the most experienced and the most sought after) at the senior colleges of City University were competitive with their peers at the private colleges, now they are far less; the ones at CUNY earn on average about $93,000, while those at non-sectarian private colleges in the city are paid an average of about $124,000.
In 1980, those teaching at religiously affiliated private colleges were earning about $75,000 (or four thousand dollars less than CUNY senior faculty); now they earn about $10,000 more per year. Given these data, it is not surprising that CUNY faculty members are severely discontent with their current salary. (For a breakdown college by college of the difference in number and salary of faculty members between 1980 and 2003, click here).
Academics are broadly representative demographically of others with a Masters or higher degree in New York City. Indeed, as Table 3 shows, the major differences between academics and others is that full-time academics have a lower household income than other full-time employed New Yorkers with at least a Masters degree, but other part-time workers live in households with lower incomes than those employed as part-time academics. Other part time workers are much less likely to be male.

Academics in New York City, especially part-time academics are struggling. New York City's large public university in no way is keeping up with the other four-year colleges in the city. Graduate students went on strike at NYU; there are grumblings at Columbia; many CUNY graduate students spend some time in the subway commuting from campus to campus. It is difficult to finish a Ph.D. program, where many students spend five, six, or seven years or more and roughly half leave without the degree . It is difficult to find an academic job, as the recent book Will Teach for Food graphically demonstrates . Swarthmore Professor Timothy Burke's very trenchant Web site "Should I Go to Graduate School?" spells out the perils of an academic career Yet, more academics are produced every year. New York City is still a place that many would be pleased to be if they could find a job, and afford to live here.
A Note on Sources
This column is based upon two sets of public data. The 2000 Census Public Use Micro-Data Samples (PUMS) from the IPUMS site and the Integrated Post-Secondary Education Data System (IPEDS), which includes data collected and maintained by the National Center for Education Statistics, but reported by the institutions. To find academics who worked in New York City, I used various codes from the PUMS data that depicted occupation, industry, type of employer and location of job. I limited my analysis to those with a Master's degree. For the data on colleges and universities, I selected those institutions that awarded at least an Associate Degree, but I did eliminate some that were trade schools or had recently lost accreditation, as well as those that were predominantly professional schools. There may be some differences in definition between 1980 and 2003, and I did not include fringe benefits, but the general patterns of change are robust.
Andrew A. Beveridge has taught sociology at Queens College since 1981, done demographic analyses for the New York Times since 1993, and been in charge of Gotham Gazette's demographics topic page since 2000. The opinions expressed are his alone. Â
Hispanics and the Ferrer Candidacy
Fernando Ferrer was the first candidate of Hispanic descent to run with major party backing for the office of mayor of New York City, and when he lost by a large margin, there was a general consensus among journalists: Ferrer, they said, did poorly among every ethnic group, even -- relatively speaking –- his own.
Some commentators sought to explain this by noting that “Hispanic” no longer means just Puerto Ricans, or even just Puerto Ricans and Dominicans. Hispanic New Yorkers come from many different countries now. Others pointed out that Bloomberg’s polling of voters was very vigorous and very specific, but that it was not based on their ethnic origins. Thus, it was possible to ask seriously whether the mayoral election signaled a new phase in New York City politics -- the beginning of the end of ethnic politics.
There was just one problem with all these explanations and conclusions -- they were based on an inaccurate consensus.
No major news organizations did their own polling; their conclusions about Ferrer’s support was based on an unconventional exit poll.
Now more data are available, including complete voting returns for all 6,000 of New York City's election district, as well as a recent exit poll among immigrants. It turns out that the vast majority of Hispanic voters did in fact choose Ferrer -– at least 80 percent. This demonstrates not just that ethnic politics is alive and well in New York City, but that, as diverse as they are, Hispanics in New York share much in common.
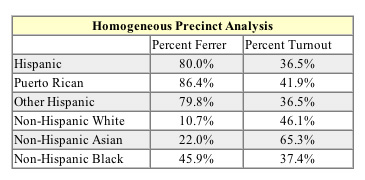
An analysis of voting preference in homogeneous election districts (those with high proportions of a specific ethnic group), reveals that Ferrer did very well among all types of Hispanics.
So why did he lose so badly?
First, turnout was markedly low in Hispanic areas. Second, other groups did not vote for him in high numbers; In areas of high concentrations of African Americans, he received less than half the vote, while he got 22 percent of the Asian vote and only 10 percent of non-Hispanic white voters.
A recently released survey by the New York Immigration Coalition produced similar results.
Characteristics Of Hispanic New Yorkers
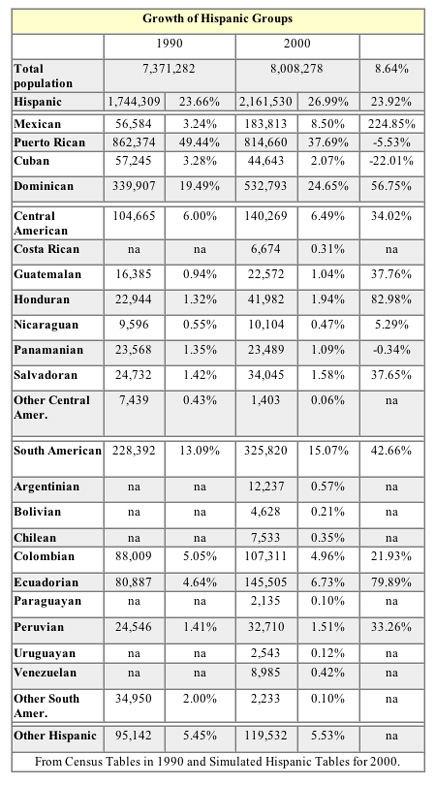
The Hispanic population in New York City is growing rapidly, and becoming more diverse. The Puerto Rican population, which still constitutes the largest Hispanic group in the city, is diminishing. Mexicans have experienced explosive growth. Other groups have grown by at least a third.
When one examines the social and economic position of Hispanics in New York City it is plain that though there are some variations among the groups, they do face similar economic challenges.
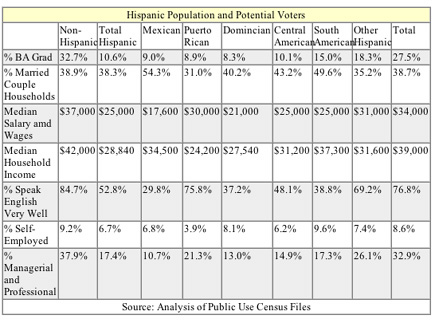
They are less educated, earn less, have lower household incomes than other New Yorkers. A smaller fraction of them speak English "very well." They also are somewhat less likely to be self-employed and much less likely to be employed in managerial and professional occupations.
It is difficult to call them a powerful voting bloc just yet, though, since most of them cannot vote. They are either under 18 or non-citizens.
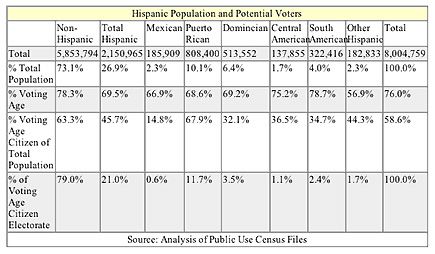
The Hispanics as a group compose about 27 percent New York City's population, but only 21 percent of citizens of voting age population. Indeed, while for non-Hispanics about two-thirds of the population are voting age citizens, for the Hispanic groups the percent is less than half; only about 15 percent of Mexicans in New York are citizens of voting age.
Andrew A. Beveridge has taught sociology at Queens College since 1981, done demographic analyses for the New York Times since 1993, and been in charge of Gotham Gazette's demographics topic page since 2000. The opinions expressed are his alone.Â
Disabled in New York City; Also: Is The City Still Booming?
Over one million New Yorkers between the ages of 21 and 64 are officially disabled, based on the classifications established by the Americans With Disabilities Act.
According to recent Census reports, about a quarter of all New Yorkers within that wide age group living on their own say that a physical, mental or emotional condition lasting six months or more has made it difficult for them to:
Learn, remember or concentrate
Dress, bathe or get around inside the home
Get outside the home alone to shop or visit a doctor’s office
Or, work at a job or business
The most common impairments concern something that affects the ability to work or to go outside the home.
New York City residents who live on their own are more likely to report disabilities than do those who live in the rest of the United States. Plainly those who have difficulties caring for themselves in their own homes also are likely to have difficulties in working and in going out of their houses.
It is the objective of those who provide services and aid to the disabled to make it easier for them to live a full life. For this reason, providing disabled New Yorkers with transportation becomes very important. Though bus-riders in wheelchairs have become a common sight, there is no other mode of transportation in the city that is as accommodating; as a result, too many disabled New Yorkers feel as if they are trapped in their homes.
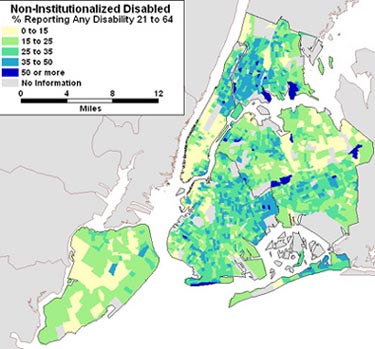
The areas with the highest rates of disability include the Bronx and Washington Heights, Elmhurst, Bellerose, Brighton, Borough Park, Long Island City and East New York. These areas have high concentrations of minority and poor residents, and some have a high concentration of immigrants.
The disabled are less likely to be white and more likely to be black than the rest of the population. A higher proportion of the disabled are born abroad and do not speak English as their first language. They are less educated: Only 17.3 percent spent four years in college compared to 33.4 percent for the rest of the population at large. They earn less money -- $23,500 median versus $30,000 for the rest, and are more likely to be in poverty.
Is The Boom Over Or Not?
There have been three recent demographic reports that together do not make very much sense.
1. Sam Roberts of the New York Times recently reported that the Census Bureau “ officially listed the city's population at 8,168,338, another record high.” He attributed this to the expert “sleuthing” of city officials.
2. The Pew Hispanic Center study found that the “inflow of newcomers peaked between 1990 and 1995, gradually declined as other states were peaking, and fell again after 2001, to about 90,000 annually, down from 168,000 in 1990. The vast majority of immigration to the state is concentrated in New York City.”
3. A study done I did showed that the top fifth of the population in Manhattan had average incomes over 50 times that of the bottom fifth.
So is the city booming or is the boom over?
During the 1990s, it is plain that high income and the availability of jobs coupled with better counting did lead to the population growth found in New York City. Immigration fueled this growth. Immigrants also tend to accept lower wages and incomes for the same work, so New York City has what some call an hour glass economy -- with a large top and bottom and little in the middle. There are the Wall Street workers, and the people who deliver their food to them. The cooks and the deliverers are immigrants; their customers are very wealthy.
But the Pew study indicates that immigration growth may have ended in the 1990s. So, how can New York City’s population still be growing? The simple answer is that maybe it isn’t – maybe simply the census bureau is doing a better job of counting the population.
Next year, however, we will have the benefit of the first full-blown large scale on-going survey from the bureau. If all goes according to plan, we will know how large is NYC’s population, and how much money New Yorkers are making – whether, in other words, New York is still booming.
Andrew A. Beveridge has taught sociology at Queens College since 1981, done demographic analyses for the New York Times since 1993, and been in charge of Gotham Gazette's demographics topic page since 2000. The opinions expressed are his alone.Â
Who Can Afford to Live in New York City?
Affordable housing has been one of the few concrete campaign issues this year; every candidate seems to have a plan. But is it possible to satisfy the need for affordable housing in New York City? Usually housing is considered unaffordable if it costs a household more than 30 percent of its income. With that definition, about 1.1 million of the 3 million households (36.7 percent) are living in housing that is not affordable to them. In fact, over 600,000 (19.9 percent) spend more than 50 percent of their income on housing. By reviewing housing databased on the U.S. Census from the federal Department of Housing and Urban Development, one can understand just how unaffordable housing is in New York City.
The department has determined that the median income for a family of four in 2000 was $52,100, and it labels income as "low," "very low," or "extremely low" depending on how far income falls below that median.
Slightly less than half of all households in New York City are considered low income (anything $41,700 or below for a family of four), and most of them must pay a large percentage of their total income to obtain housing -- whether they are renting their home, or own it. Almost two thirds of these households spend more than 30 percent of their income for housing. Almost two-fifths spend more than 50 percent on housing.
Housing is even less affordable for those with very low (under $26,050) or extremely low (under $15,650) incomes.
To live in New York City and not spend a tremendous fraction of your income on housing requires the household to have higher income. Even among those with higher incomes, 13.4 percent spend more than 30 percent of their income on housing. (Only 2.9 percent spend more than half). These results and others are in the accompanying table.
|
Cost Burden for Housing for Various Income Levels
|
||||||
|
Rental Units
|
Owner Units
|
Total
|
||||
| Extremely Low Income |
||||||
| Total |
555,562
|
|
72,386
|
|
627,948
|
|
| % Cost Burden >30 % |
395,005
|
71.1%
|
51,466
|
71.1%
|
446,471
|
71.1%
|
| % Cost Burden >50 % |
331,115
|
59.6%
|
44,445
|
61.4%
|
375,513
|
59.8%
|
| Very Low Income |
|
|
|
|
|
|
| Total |
833,300
|
|
137,538
|
|
970,838
|
|
| % Cost Burden >30 % |
594,143
|
71.3%
|
97,920
|
71.2%
|
691,980
|
71.3%
|
| % Cost Burden >50 % |
419,991
|
50.4%
|
74,741
|
54.3%
|
494,839
|
51.0%
|
| Low Income |
|
|
|
|
|
|
| Total |
1,181,311
|
|
250,449
|
|
1,431,760
|
|
| % Cost Burden >30 % |
737,871
|
62.5%
|
159,005
|
63.5%
|
896,630
|
62.6%
|
| % Cost Burden >50 % |
445,396
|
37.7%
|
111,324
|
44.4%
|
556,602
|
38.9%
|
| Non-Low Income |
|
|
|
|
|
|
| Total |
927,421
|
|
661,672
|
|
1,589,093
|
|
| % Cost Burden >30 % |
84,395
|
9.1%
|
128,364
|
19.4%
|
212,938
|
13.4%
|
| % Cost Burden >50 % |
13,911
|
1.5%
|
31,760
|
4.8%
|
46,084
|
2.9%
|
| All Units |
|
|
|
|
|
|
| Total |
2,108,732
|
|
912,121
|
|
3,020,853
|
|
| % Cost Burden >30 % |
822,405
|
39.0%
|
287,318
|
31.5%
|
1,108,653
|
36.7%
|
| % Cost Burden >50 % |
459,704
|
21.8%
|
143,203
|
15.7%
|
601,150
|
19.9%
|
It is important to emphasize that New Yorkers spend a large amount on rent even though New York City is one of the few places in the United States with rent regulation. It also has a very large number of its residents living in public housing or availing themselves of other federal subsidies, and there are also such housing programs for the middle-class as Mitchell-Lama housing. Yet, when compared to the 107 places in the United States that have at least 100,000 housing units, New York City ranks first in the proportion of "low income" residents who pay more than 50 percent of their income for housing costs, and ranks fourth for all residents whatever their incomes who pay more than half, following Miami, Los Angeles, and San Juan, Puerto Rico. The accompanying map shows the distribution of those households who pay more than 50 percent of their income throughout New York City.
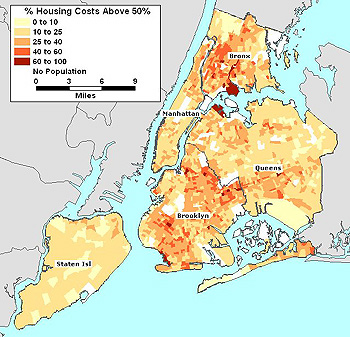
Housing cost burdens are highest in areas of most poverty. An earlier columndefined the areas where the poor live.
These areas, include, the following:
• The Bronx, including the South Bronx; part of Harlem;
• Brooklyn, including the area around Bedford Stuyvesant and Flatbush, as well as some parts of Greenpoint and Williamsburg,
• In Queens, some areas of Jamaica.
Many of the residents living in these areas are either in a housing project or have a housing subsidy, yet they still spend a very large amount of their income on rent.
The conclusion is inescapable: Many low income New York City residents cannot afford the homes in which they are living. For all the publicity in the mayoral race given to affordable housing plans, given the scope of the problem, these amount to little more than token developments for a lucky few. Â
Can NYC Profile Young Muslim Males?
Earlier this month Assemblyman Dov Hikind and Councilmember James Oddo both suggested that random searches in the subway weren’t good enough; the police should target particular people. “When we look at the list of the most-wanted people by the FBI in terms of terrorism, they fit a profile," Hikind said. "They look a certain way, they are young, and they come from a certain part of the world.” Oddo was even more explicit in a commentary he wrote for the Daily News: "It is important to acknowledge that nearly every Jihadist who has engaged in terrorist attacks has been a young man who called himself Muslim - the common denominator among the recent bombings in London and Madrid, the 9/11 attacks, the 1993 World Trade Center bombing, the would-be millennium bombers, the destroyer Cole, the embassies in Kenya and Tanzania, Pan Am Flight 103, TWA Flight 847 and the bombing of the Marine barracks in Lebanon.”
But even if the New York Police Department wanted to do so – and it has said clearly that it doesn’t -- profiling young Muslim males is virtually impossible. They are not as easy to spot as Oddo and Hikind seem to think.
Muslims live in most countries throughout the world. Click here for a chart that shows the countries with the highest Muslim population. China ranks ninth. Russia ranks 18th. Indonesia has the most absolute number of Muslims, more than 88 percent of their population is Muslim, and yet there are 30 countries that have a higher proportion of Muslims.
So, some Chinese New Yorkers may be Muslim, while some Indonesians may not be. But let’s take the 25 countries in which at least 50 percent of the population is Muslim. There are 231,000 New Yorkers who claim heritage from these 25 countries, as the following table shows.
| Number and Percent Those With Muslim Country Heritage | ||
|
Heritage
|
Number
|
%
|
| Afghan | 4,448 | 1.93% |
| Albanian | 26,260 | 11.39% |
| Arab | 14,766 | 6.41% |
| Bangladeshi | 32,335 | 14.03% |
| Bosnian | 2,838 | 1.23% |
| Croatian | 11,971 | 5.19% |
| Egyptian | 16,346 | 7.09% |
| Eritrean | 323 | 0.14% |
| Indonesian | 3,601 | 1.56% |
| Iranian | 7,937 | 3.44% |
| Iraqi | 1,006 | 0.44% |
| Jordanian | 956 | 0.41% |
| Lebanese | 11,332 | 4.92% |
| Malaysian | 2,695 | 1.17% |
| Middle Eastern | 1,075 | 0.47% |
| Moroccan | 4,982 | 2.16% |
| Nigerian | 16,904 | 7.33% |
| Pakistani | 40,051 | 17.37% |
| Palestinian | 3,334 | 1.45% |
| Sierra Leonean | 795 | 0.34% |
| Somalian | 17 | 0.01% |
| Sudanese | 943 | 0.41% |
| Syrian | 11,685 | 5.07% |
| Turkish | 12,357 | 5.36% |
| Yemeni | 1,578 | 0.68% |
| Total | 230,535 | |
Some are black, some are Asian; more than 50 percent are white.
Muslims will be much more difficult to pick out from a New York crowd. They are not racially or physically distinct.
But even if one could pick out Muslims as they boarded the subways or airplanes, there is demographic evidence that it would be a wasted effort. When compared with other New Yorkers those whose heritage is a Muslim-majority country are richer, better educated and more likely to be married than other New Yorkers. Most are citizens.
| Characteristics of Those With Muslim Country Heritage | ||
| Ancestry Muslim Country | All Others | |
| Male | 55.8% | 45.6% |
| Black | 9.2% | 28.9% |
| White | 56.8% | 47.3% |
| Asian | 35.6% | 10.1% |
| Other | 14.6% | 17.3% |
| Four Years or More College | 37.3% | 27.3% |
| Married With Spouse | 61.3% | 44.3% |
| Non-Citizen | 43.7% | 19.9% |
| Working | 58.5% | 52.9% |
| Owned House | 25.7% | 30.4% |
| Median Household Income | $40,000 | $37,000 |
This is also true of Arab-American New Yorkers , as I demonstrated previously.
Profiling by origin is the sort of policy that seems appealing during periods of stress and hysteria, but in hindsight is almost always seen as a mistake – such as the internment of Japanese-American during World War II. In this case, however, it wouldn’t even be possible.
Andrew A. Beveridge has taught sociology at Queens College since 1981, done demographic analyses for the New York Times since 1993, and been in charge of Gotham Gazette's demographics topic page since 2000. The opinions expressed are his alone.Â

