New York's Creative Class
New York City is a world center for the creative arts: drama, music, dance, entertainment of every kind, art, photography, writing and publishing. Those hoping to be successful in these fields flock to New York City. These creative New Yorkers make the city distinctive in many ways - not just as a cauldron for innovation in the arts, and a magnet for tourism and conventions, but also as an engine of the economy: A new study for Lincoln Center found that the arts complex generated $1.52 billion in sales and employed 15,200 workers. Some argue that urban economic development and growth depend upon "The Creative Class."
Who are the individuals that make New York City the creative center that it is? Where do they come from, how are they faring? By analyzing census data we can get some answers.
How Many Are There? Where Do They Live?
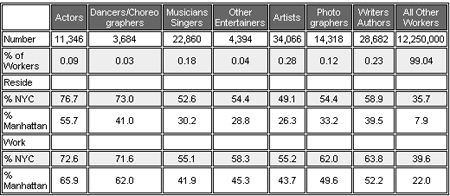
Those who work in the creative and performing arts make up less than one percent of those who either worked or lived in the New York City metropolitan area, according to the 2000 Census. These included:
- 34,066 artists
- 28,682 writers and authors
- 22,860 musicians or singers
- 14,318 photographers
- 11,346 actors
- 3,684 dancers and choreographers
And 4,394 other entertainers.
Over a quarter of the people in these groups made their home in Manhattan, including 56 percent of all actors and 41 percent of all dancers.
This is sharp contrast to New Yorkers over all; only eight percent of people who either work or live in one of the five boroughs, reside in Manhattan.
Wherever they live, most creative professionals work in the city -- 73 percent of actors, 70 percent of dancers, 55 percent of artists -- most of these in Manhattan.

Who Are They Ethnically, Etc.?
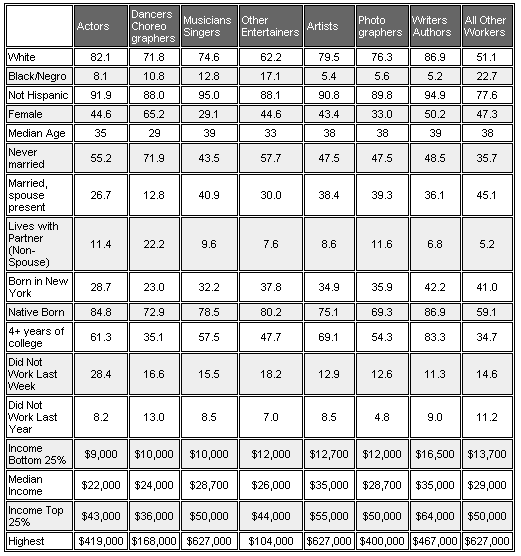
A higher fraction of New York City's creative workers are white (e.g. actors 82 percent, artists 80 percent) than are other workers (51 percent).
Dancers are more likely to be female, but photographers and musicians are more likely male. A higher proportion than other New York City workers have never married. Members of the creative class are much better educated than other New York City workers, except for dancers; a much greater proportion finished at least four years of college. It is clear that many move from other parts of the United States to New York for their art. Fewer than average were born in New York State, but much more than average were "native-born", born in the United States, as opposed to abroad.

Struggling Or Thriving?
There are large differences among the various creative fields in terms of whether they worked at all "last week". About 28 percent of all actors did not work in the last week - the largest proportion out of work. Except for dancers, those in creative fields were more likely to have worked in the last year than other New York City workers.
However, the creative worker, except for artists and writers, earn less than the average New York worker; actors and dancers earned the least.
Considering how well educated the creative workers are they do not earn what their skills and background would command in more conventional fields. The average New York worker earned $29,000 in 1999. By contrast, one quarter of all actors earned $9,000 or less. Except for writers, the bottom quarter of each creative group earned less than did the bottom quarter of all New York City workers.
On the other hand, it really is possible to hit it big in New York in the arts. The top quarter of most creative groups earned as much or more than the top quarter of New York City workers as a whole. Some musicians and singers and artists reached the maximum reported income in New York in 1999, $627,000. (Of course, this represented just a small number, and it is not clear how accurate the numbers; the very wealthy among any group are well known to be much harder to reach and much less likely to give full information about their income.)
Generally, though, the creative in New York City, especially actors and actresses, earn less than the average New Yorkers, much less than New Yorkers of similar education and skill level. Some exist on very meager incomes and supplement their earnings from creative endeavors with that from waiting on tables, driving taxis, working in telemarketing and so on.
A few earn phenomenal amounts of money and live the celebrity dream, and a few more become quite successful and live comfortable upper middle class lives. But for the most part, if New York City's creative workers are a driving force for urban development, they are not the main beneficiaries.
The Citizen
|
The Citizen is in another location. If you are not automatically directed to the correct page, click the following link: |
New York City Is a Non-Voting Town
Though it is common to call New York City a Democratic town, Democrats are actually in the minority. In election after election, the solid majority is made up of non-voters.
That is how roughly only 15 percent of all New Yorkers eligible to vote made Michael Bloomberg the mayor in 2001. In the last presidential election, in 2000, fewer than half of New Yorkers eligible to vote bothered to do so - and that is the highest it ever gets.
So who are these non-voters?
First of course are those who are not eligible to vote. Of the six million New Yorkers who are 18 years of age and older, only about 4.7 million are citizens. Breaking that down ethnically, there were:
• 12 percent of non-Hispanic whites not eligible to vote
• 20 percent of non-Hispanic blacks not eligible to vote
• 34 percent of Hispanics not eligible to vote
• 54 percent of Asian not eligible to vote
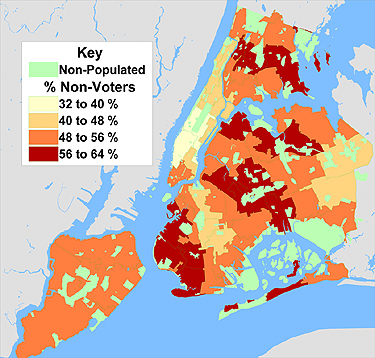
As the accompanying map shows, the areas with the smallest proportion of non-voters are in Manhattan, including the Upper East Side, the upper west side and areas south of 59th Street.

The highest proportion of non-voters live in
- Bensonhurst, Borough Park, and Bay Ridge in Brooklyn
- East Tremont and Bronxdale in the Bronx
- Astoria, Flushing and East Elmhurst in Queens, along with Middle Village, Howard Beach, and Ozone Park.
In short, there is no direct relationship between economic distress of an area and non-voting among those eligible.
Every two years after every national election, the United States Census Bureau asksa representative sample of the US population if they voted. Using those data for the period after the 2000 Presidential election one can get a picture of those who do not vote even for President. (Of course asking someone whether or not he or she voted is likely to elicit a certain amount of lying. Indeed, about 55 percent of those sampled claim they did vote, about seven percent more than those who actually did.)
- Women are more likely to vote than men (57 percent to 52 percent).
- Blacks are more likely to vote than whites (61 to 57 percent).
- Renters are slightly more likely to be voters than owners (57 to 54 percent).
- Those that own a business are more likely than those who do not (62 to 55 percent).
- Those working and those retired are more likely to vote than those without jobs (60 to 50 percent). However, there is no relationship between family income and voting.
Those in higher status occupations and those with college degrees voted at a higher proportion than others eligible (68 to 55 percent).
Those married with spouse present, as well as those widowed, divorced or separated voted at much higher rates than singles or those living without their spouse. Those born in the United States were slightly more likely to vote, while those from Puerto Rico were slightly less likely to vote.
Though some demographic and other groups do vote at a somewhat higher rate than others, it is nonetheless the case that for virtually every population category non-voting is rampant. This is all the more true in non-Presidential contests, even when a handful of votes would make a difference.
Andrew A. Beveridge has taught sociology at Queens College since 1981, done demographic analyses for the New York Times since 1993, and provides expert testimony on a range of cases, including housing discrimination. The opinions expressed are his alone.


