Harlem's Shifting Population
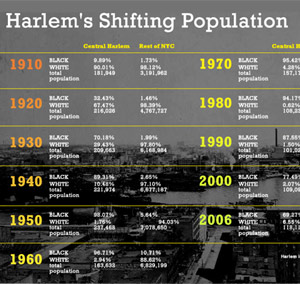
This is the text version of the chart included in An Affluent, White Harlem?
Townhouses in Harlem sell for millions of dollars and Columbia University continues to expand there, as the city foresees even greater changes again. Andrew Beveridge examines what it could mean for the future of America's most famous black community.
| Central Harlem | Greater Harlem | Rest of NYC | |
|
* Numbers do not add up to 100 percent. The remaining Harlem residents are HIspanics, who were not listed separately until 1980, and individuals who identified themselves as members of other racial groups. |
|||
|
Sources: 1910 to 1940, Census Tract Data from National Historical Geographical Information System, Compiled by Andrew A. Beveridge and Co-workers; 1950, Ellen M. Bogue File, as edited by Andrew A. Beveridge and co-workers; 1960 through 2000, Tabulated Census Data from National Historical Geographic Information System; 2006 Data from American Community Survey, U.S. Bureau of the Census. Boundary Files from National Historical Geographic Information System 1910 to 2000, U.S. Bureau of the Census, 2006. All data and boundary files available from Minnesota Population Center. Since results are tabulated from the sources indicated, they may not necessarily match Census published figures for population and race. |
|||
| 1910 | |||
| BLACK | 9.89% | 4.28% | 1.73% |
| WHITE | 90.01% | 95.64% | 98.12% |
| total population | 181,949 | 593,598 | 3,191,961.84 |
| 1920 | |||
| BLACK | 32.43% | 12.28% | 1.46% |
| WHITE | 67.47% | 87.60% | 98.39% |
| total population | 216,026 | 652,529 | 4,767,727 |
| 1930 | |||
| BLACK | 70.18% | 34.82% | 1.99% |
| WHITE | 29.43% | 64.78% | 97.80% |
| total population | 209,663.38 | 580,277.29 | 6,168,983.97 |
| 1940 | |||
| BLACK | 89.31% | 48.32% | 2.65% |
| WHITE | 10.48% | 51.38% | 97.10% |
| total population | 221,974.31 | 576,845.91 | 6,677,186.53 |
| 1950 | |||
| BLACK | 98.07% | 57.52% | 5.64% |
| WHITE | 1.76% | 41.89% | 94.03% |
| total population | 237,467.79 | 593,246.28 | 7,078,649.58 |
| 1960 | |||
| BLACK | 96.71% | 58.53% | 10.71% |
| WHITE | 2.94% | 40.55% | 88.62% |
| total population | 163,632.28 | 467,633.59 | 6,829,199.34 |
| 1970 | |||
| BLACK | 95.42% | 63.53% | 18.48% |
| WHITE | 4.28% | 34.44% | 79.82% |
| total population | 157,178.07 | 430,567.1 | 7,083,454.85 |
| 1980 | |||
| BLACK | 94.17% | 58.76% | 22.20% |
| WHITE | 0.62% | 10.29% | 53.98% |
| total population | 108,236 | 339,490 | 6,732,149 |
| 1990 | |||
| BLACK | 87.55% | 52.37% | 23.93% |
| WHITE | 1.50% | 10.85% | 44.74% |
| total population | 101,026 | 334,076 | 6,988,199 |
| 2000 | |||
| BLACK | 77.49% | 46.03% | 23.67% |
| WHITE | 2.07% | 10.45% | 36.11% |
| total population | 109,091 | 354,057 | 7,654,221 |
| 2006 | |||
| BLACK | 69.27% | 40.54% | 23.40% |
| WHITE | 6.55% | 14.80% | 36.06% |
| total population | 118,111 | 374,854 | 7,838,724 |
Â
An Affluent, White Harlem?

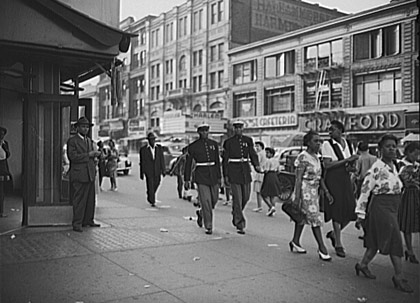
Lenox Terrace, where U.S. Rep Charles Rangel had four apartments, now qualifies as a luxury building. Townhouses in Harlem sell for one, two and even more million dollars, as real estate developers build new condos in Hamilton Heights and elsewhere, Meanwhile Columbia University arranges to get much of West Harlem declared blighted so its expansion in Harlem, past the Fairway grocery store and Dinosaur Barbecue, can march on.
With the recent city rezoning of the area (see related story), many residents fear they will be pushed aside by new development. What is happening to Harlem? Is it becoming white? Is it becoming a neighborhood for the rich?
Harlem has gone through many changes since 1910. How far the latest transformation will go, though, remains to be seen.
As with many New York neighborhoods, defining Harlem's boundaries can be difficult. Central Harlem follows the definition set out by Gilbert Osofsky in his 1966 book Harlem: The Making of a Ghetto. The southern edge starts at 96th Street on the East Side; at Fifth Avenue and Central Park it goes up to 110th, and then cuts over to 106th Street on the West Side. The northern boundary of the area in most places is 155th Street, though it extends a bit further up on the East Side. Central Harlem is basically north of Central Park and east of Morningside and St. Nicholas avenues.
Prior to 1910, most of Harlem's settlers were middle class, including many notable African Americans. In the 1920s, an efflorescence of culture known as the Harlem Renaissance occurred, and the Apollo Theatre and the Savoy Ball Room were founded. As the "great migration" of blacks from the American South continued, and the size of the black population expanded, an area of concentrated poverty developed. Kenneth Clark's 1996 book, Dark Ghetto, certainly was influenced by Harlem.

The changes in Central Harlem and New York City are shown in the table. In 1910, Central Harlem was about 10 percent black, Greater Harlem was a little more than 4 percent black, while the rest of New York City was less than 2 percent black. By 1930, Central Harlem was over 70 percent black and Greater Harlem was about 35 percent black, but the rest of New York City was still less than 2 percent black. In short, by 1930, during the Harlem Renaissance, Central Harlem had become very definably black area in a largely white city. By 1950, Central Harlem was about 98 percent black, while Greater Harlem was 57.5 percent black.
Central Harlem lost more than half of its population between 1950 and 1980, and Greater Harlem also saw its population drop as well. This was a period of sharp economic decline in New York City, especially for the black community. This also marked the era of urban renewal, and many older housing units were razed either for public housing projects or for other apartment developments. The new developments did not come close to housing the same number of people. Almost all of the people who remained in Central Harlem, though, were black.
Since1980, Central Harlem has become less black, and by 2006 a smaller percentage of the population was black than in 1930. Meanwhile, the white and Hispanic populations rose. In 1980, there were 672 whites in Central Harlem, constituting about 0.6 percent of the population. By 2006 that figure had increased to 7,741 or about 6.6 percent. Hispanics accounted for 4.3 percent of Harlem residents in 1980, the first year they were classified separately. In 2006,that number reached 18.6 percent.
In short, there had been a turnaround of sorts in Harlem. The white population that had moved to Harlem by 2000 was distributed in many different areas. Between 1980 and 2000, there has been a decline in the concentration of blacks in Harlem. Furthermore, according to the 2006 American Community Survey, the overall decline in black population has continued.
In the early days of Harlem, the black community there was quite diverse, especially when African Americans in Harlem were compared to those who lived elsewhere. During the period of the rapid influx into the area, the level of concentrated poverty increased in Harlem. That accelerated during the 1950s through the 1970s with urban renewal, housing deterioration and a decline in population. At the same time, areas such as Southeast Queens attracted affluent black families.
Now it appears that areas of Harlem are sought after once again. By 2000 and 2006, there were areas of some highly affluent black and white residents. Median household income in Central Harlem had increased from about $13,765 in 1950 to over $26,161 in 2006, in 2006 dollars. Still, this figure is well below the median of $46,285 for the rest of New York City.
Harlem has changed from an impoverished area with a few middle-class families to one where some middle-class people, including a few whites, have moved in and made their homes. In some parts of Harlem, blacks have been joined by Hispanics, but that percentage has not grown much since 2000. Rather, the new residents of Harlem seem to be non-Hispanic white and non-Hispanic, who consider themselves to be "other race," neither black nor white. The traditional townhouse areas around Strivers Row, Sugar Hill and Marcus Garvey Park have undergone a rebirth. Stores and restaurants catering to the affluent have opened in West Harlem, while Magic Johnson opened a Starbucks and a Multiplex on 125th Street, near where former President Bill Clinton has his office suite. Columbia University's expansion will bring more change to West Harlem.
What these changes portend for New York City's iconic black neighborhood is hard to fathom. On the one hand, new residents mean that Harlem will have more diversity of income, occupation, educational level and race than it did in the 1970s and 1980s. At the same time, the large stock of public housing and the relatively low income means that high levels of poverty will continue to be a feature of Harlem. Harlem will not lose its black majority or its high concentrations of poverty anytime soon.
Andrew A. Beveridge has taught sociology at Queens College since 1981, done demographic analyses for the New York Times since 1993, and been in charge of Gotham Gazette's demographics topic page since 2000. The opinions expressed are his alone.ÂThe School Divide Starts at Kindergarten
The recent baby boom in New York City led to an increasing squeeze in the search for the best school for the budding kindergartner or first grader. Unlike other recent spurts in enrollment, the latest surge has had the great effect in Manhattan, especially among highly affluent non-Hispanic white families
The number of white toddlers (ages 0 to 4) in the city has increased greatly. In decades past, white families and more affluent families would often leave New York City for the suburbs, where the schools were small and elite (at least according to who lived there) and open to all residents. Now more of these families prefer to stay in New York City.
The impacts of the new trend are reverberating throughout New York City's elementary schools -- public and private, elite and neighborhood. One of the city's top elementary schools, Hunter, saw 1,550 children apply for 48 slots. The large increase in students sitting for the private school exams document that this is indeed the year of the crunch.
Many affluent parents have seen public school Gifted and Talented programs as a viable - and free -- alternative to private schools, but critics have long maintained the system unfairly favored these children, shortchanging those in poorer black and Hispanic areas. This year the city adopted a standardized test with uniform standards to select those eligible. However, we now know that this method resulted in a much less diverse program according to the New York Times.
Finally, just getting ones child into a neighborhood school seems to have turned into a difficult process for some. Confusion, competition for limited slots and changes in the selection methods for the relatively few desirable elementary programs seem to be the order of the day.
Who Goes Where
Which kids go to public schools and which attend private schools in New York City? Which get into the sought after programs, such as Hunter or the Gifted and Talented programs? What do we know about the location, race, ethnicity and economic standings of the families of New York City's elementary school parents, public and private, gifted and not so gifted?
To answer some of these questions I pieced together data from the Census and the Department of Education, and created some simple maps. Beyond this, using some estimates based upon reasonable guesses of the test outcomes, I was able to get some idea of the composition of the Gifted and Talented programs. Simply put, the kids who find their way into the preferred programs, whether public or private are much different than the average New York City elementary kid. They are much more likely to be from intact, higher income families and to be non-Hispanic white.
Private School Kids are Different
Now that Gossip Girl is on TV, and Horace Mann's violations of academic and due process have been exposed by New York Magazine, outsiders may sense that private school kids are different from public school kids, at least in high school. Of course, most private schools are not at the rarefied financial and academic levels of Collegiate, Brearley, Spence, Horace Mann, Ethical Culture and the like. Indeed, the vast bulk of private schools in New York City are run by the two Catholic archdioceses, while there are yeshivas, along with a few Lutheran, Muslim and other religious schools.
In 2006 about 22 percent of 518,000 elementary students (kindergarten through grade 4) attended private school according to the census's American Community Survey. Table 1 compares the elementary private school kids with those attending public school.

|
|||||||||||||||||||||||||||||||||
Only about 17 percent of the public school kids are non-Hispanic white, compared with about 57 percent of the private school kids. The private school kids are also less likely to be Hispanic, black or Asian than public school kids. While about 79 percent of kids in private school come from married couple families, only half the public school kids do. The median family income of the private school kids is $63,000 almost double that of public school kids with $33,750. Most of those parents who chose private schools for the children are willing and able to pay the tuition. Many, many public school families never could.
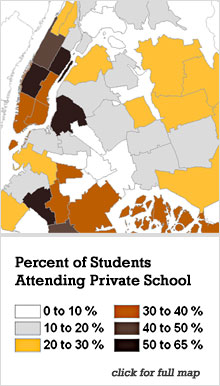
Map 1 presents the percent of elementary children by sub-borough (which follow the boundaries of community planning districts, except that two in lower Manhattan and two in the Bronx are combined.) As that map makes plain, in the Upper East Side of Manhattan (the home Gossip Girl) more than half of all elementary kids attend private school. This percentage is quite high in other parts of Manhattan, as well, including the Upper West Side and midtown and downtown. It is in exactly in these areas that the baby boom for non-Hispanic whites has occurred in the last few years.
In Brooklyn, the percent of children attending private school is especially high in Williamsburgh and Greenpoint, as well as in Borough Park. Here, of course, there is a high concentration of observant Jewish parents, Also in Brooklyn, the area including Sheepshead Bay has relatively high private school enrollment. Private schools, even the religious ones, cater to the parents with some means and enrollment is concentrated in those areas.
Deciding Who's Gifted
The rejiggered selection criteria for slots in New York City's Gifted and Talented program, requires taking a test, usually in kindergarten, and scoring in the 90th percentile. Students who clear this hurdle are likely be from non-Hispanic white families and from affluent families. Many of their parents can afford pre-school, lessons, nannies and the like. When their children take a test, even at age four or five, they are prepared and have a huge advantage over other students.
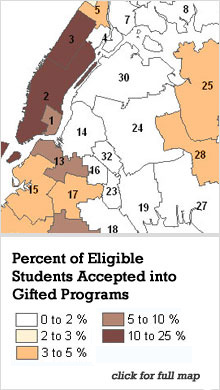
The Department of Education has not released full data about the racial and Hispanic composition, as well as the eligibility status for "free or reduced lunch program," of the admitted students. What we do know is that the number of students qualifying for gifted and talented slots radically changed for many districts between last year and this year. This year District 2 in a large swath of Manhattan had 15.2 percent of its students qualifying, while District 3, on the Upper West Side, qualified 22.3 percent. Most districts were well below 5 percent. Map 2 gives the overall rate of gifted and talented students qualified compared to the total in the cohort. These figures include all students who would be eligible for the first time for Gifted and Talented programs this year, whether or not they applied.
The percent of non-Hispanic whites and the percent not qualifying for free and reduced lunch is highly correlated with percent qualifying for Gifted and Talented programs. Using data from the Early Childhood Longitudinal Study of Kindergarten, I found that non-Hispanic whites are much more likely than non-Hispanic blacks or Hispanics to score in the 90th percentile or above on a cognitive test. Their performance does vary by which test -- math, language or general knowledge -- is being used.
Since New York City now uses similar tests to screen for gifted and talented, I assumed that non-Hispanic whites would outperform Hispanics and non-Hispanic blacks, and would have a 150 percent greater chance to meet the cutoff for the Gifted and Talented classes. For 100 non-Hispanic blacks and 100 non-Hispanic whites, this means that if 10 non-Hispanic whites meet the cutoff only two non-Hispanic blacks would do.
Performance on tests taken at kindergarten is highly influenced by the student's family environment of the student. This means the actual difference between white students and other may be even greater in New York City, where there are very high differences in income and education between non-Hispanic blacks and non-Hispanic whites, especially in Manhattan.
The results of the estimates are shown in Table 2.

|
|||||||||||||||
Non-Hispanic whites and Asians almost triple their percentage, while the percent non-Hispanic black and Hispanic plunges. In short, students accepted in the Gifted and Talented program are not all representative of the students in New York City, and less so this year than last year.
As the baby boom in Manhattan shows little sign of ebbing, we can expect the middle class kindergarten crunch to continue. Parents here can chose between many types of private and religious schools, selective schools, their neighborhood elementary school or gifted and talented program. But the suburbs are just a short train ride away, and many have lots of slots for new elementary school students available to anyone who can afford to live there.
Â


