Hitting the 9 Million Mark
New York City’s population will reach 9 million around 2025, according to a spate of demographic projections featured in various news stories. But will the city really hit the 9 million mark in the next 20 to 25 years, as Con Edison, researchers for the Metropolitan Transportation Council, and Deputy Mayor Daniel Doctoroff predict?
The answer is a resounding yes, if one accepts the underlying assumptions of such projections. But since, like all projections, these estimates seek to predict the future, we will not be able to judge their accuracy for many years to come.
To get a sense of their accuracy though, we can compare projections with recent estimates and with patterns of historical growth. Urbanomics has produced one of several such studies projecting 9 million New Yorkers. To arrive at that number, it expects a growth rate in New York City higher than the rate between 1940 and 2000 and well in excess of what has occurred since 2000, as estimated by the U.S. Census Bureau.
Estimating New York City
The census estimates of New York City's population in the 1990s vastly underestimated the city's growth. (See Gotham Gazette.) Since 2000, however the bureau changed its procedures. It is instituting a new American Community Survey to provide a yearly census update. Along with records of births, deaths, and internal migration from the Internal Revenue Service data, that survey tracks the foreign born population. The first full release of the survey is due at the end of August and could change the picture of the city’s current and projected growth.
But the figures now available indicate that, since 2000, the estimated growth rate varied from a high of 0.718 percent between 2000 and 2001 to a small loss in population between 2004 and 2005. On average, the estimated growth rate since 2000 has been 0.353 percent. (These figures are summarized in Table 1.) Now many theorize that the growth rate has surely slowed, a consequence, they believe, of a slight ebbing in immigration, the end of the stock market boom, and the shock of 9/11.
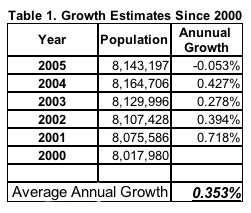
But despite all that Urbanomics projects a much higher growth rate of 0.564 percent for the 30 years through 2030. Since the city’s population increase for the first five years of that period has already failed to reach that level, New York City’s growth must rise in the next few years if Urbanomics and its colleagues are to turn out to be correct.
A Century of Population Growth
New York has been the largest city in the country since 1790. (Since the consolidation of the city in 1897, the city population includes all five boroughs.) Table 2 shows the census population for each decade from 1900 through 2000, the percent change from the previous census, and the annual growth rate (compounded).
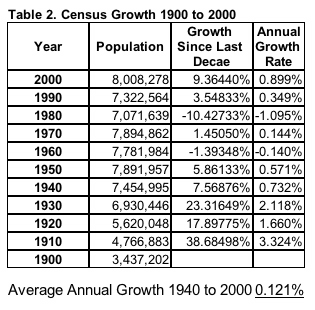
The decades from 1900 through 1930 were years of explosive growth. In many ways, New York City was the Sunbelt of the 1910s and 1920s, with its population more than doubling from 1900to 1930.
But to evaluate the new projections, the decades from 1940 through 2000 are especially relevant, since by 1940 much of New York City's transportation infrastructure was completed, the vast bulk of its road network already existed, and many buildings still in use had been erected. In short, New York City looked much like it does today in many ways.
As the data make plain, New York City was very near the 8 million mark twice -- 1950 and 1970 -- but in both instances the city then lost people. Indeed the population was officially at little more than 7.3 million in 1990. Economic downturn, white flight and the slowing of immigration until the 1980s led to New York City's slow growth until the last decade of the 20th century.
Then, quite unexpectedly, the population reached 8 million in 2000, spurred largely by the city's economic rebound and the robust increase in immigration.
Some of the apparent growth from 1990 to 2000 was simply the result of better counting in 2000. The difficulties and uncertainties in counting New York City's population led to a substantial undercount in 1990.
Despite all this, though, during the whole period from 1940 through 2000 the average growth rate (compounded) was 1.21 percent, less than one-quarter of the optimistic rate projected by Urbanomics and similar prognosticators for the next 30 years.
Assuming and Projecting
The latest high growth projections imply a population growth rate that vastly outstrips the historic growth patterns in New York City from 1940, as well as the recent brisk growth estimated since 2000. Small differences in a rate of growth for one year, when compounded, result in very large differences in projections.
If New York City grew during the 30 years after 2000 at the rate it averaged from 1940 to 2000, including that period’s booms as well as its two population declines, the population by 2030 would be about 8.3 million. If the average growth for the 30 years starting in 2000 matches the recent census estimates, New York City will almost reach 8.9 million by 2030. But the Urbanomics estimate expects an average growth rate of 0.564 percent through 2030 resulting in almost 9.5 million New Yorkers.
So, in predicting the future, it depends on how one views the past and the present. Historical population trends would seem to imply very little growth in population between now and 2030. A continuation of recent trends would imply somewhat more growth. And relying on a series of economic assumptions could put New York City's population at about 9.5 million by then.
Framed this way, it seems it could well take considerably more time than Urbanomics and others predict for New York City's 8 million to become 9 million. But only the future will tell for sure.
Andrew A. Beveridge has taught sociology at Queens College since 1981, done demographic analyses for the New York Times since 1993, and been in charge of Gotham Gazette's demographics topic page since 2000. The opinions expressed are his alone.Â
New York's Asians
Who are the Asians of New York City? They are foreign-born and native-born New Yorkers with a background in East Asia (China and Japan, for example), Southeast Asia (Vietnam, Thailand, Cambodia), and South Asia (India, Pakistan and Bangladesh), according to the official U.S. government classification of the Asian race. (Those from Central Asia -- Afghanistan, Iraq, Turkey, etc. -- are not included.) Members of these diverse populations now constitute about 11 percent of the city's population.
But can one really consider as one race people coming from several continents and speaking many different languages?

It should not be surprising that Asian groups vary greatly from one another.
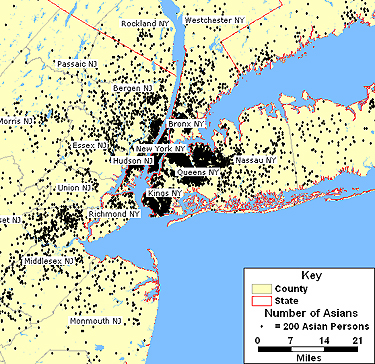
Taken as a whole, though, there are some generalizations that can be made based on recent census data. The vast bulk of Asians in the metro area live in or near New York City, as the accompanying map shows. In fact, over half of all Asians in the tri-state area live in the city.
Asian households also have higher median household income than any other of the main racial groups except for whites.

But there are sharp differences as well. The command of the English language varies greatly by group. Only about 38 percent of Bangladeshi speak English well, while over 80 percent of Filipinos do. The proportion of those over 25 years of age who have a BA degree also varies greatly, from a low of 9.1 percent for the Laotians, to a high of 74.4 percent for the Taiwanese. The proportion holding a professional and managerial job varied from 8.4 percent for Laotian and 17.2 percent for Bangladeshi to over 66 percent for the Taiwanese. The percent self-employed also varied greatly, with Koreans in the lead with 18 percent. In terms of wages the Taiwanese and Japanese had median wages of $50,000, while the Bangladeshi had only $20,000. Other groups were also quite low including: Thai, Vietnamese, Maylaysian and Indonesian. Household income also varied greatly among the Asian groups. Figures for the Filipino was $73,000, while Japanese, Asian Indian, Cambodian, Taiwanese and Sri Lankan were all at least $60,000. However, Bangladeshi, Maylaysian, Indonesian and Asian not-specified all report median household incomes less than $40,000.

Growth of the Asian groups in the New York area has been dramatic for the last several decades. Though growth since the 2000 Census is not reported for the various Asian groups in a reliable way, the pattern of growth shown in the accompanying figures likely has continued.
The charts show a dramatic increase in Chinese (which includes mainland, Taiwanese and other Chinese), and in Asian Indian, which includes Pakistani, Bangladeshi and Indians, as well as in the Filipino population. The growth of Korean and other groups though marked is not as strong.


Andrew A. Beveridge has taught sociology at Queens College since 1981, done demographic analyses for the New York Times since 1993, and been in charge of Gotham Gazette's demographics topic page since 2000. The opinions expressed are his alone.Â
Undocumented Immigrants
New York City certainly has a lot at stake in the current debate in Congress over the most significant change in immigration policy in decades. More than a third of all New Yorkers are foreign-born. In the year 2000, New York was home to some 2.8 million immigrants, which is more than nine percent of all immigrants in the United States.
But if neither the pro-immigrant demonstrations nor the anti-immigrant rhetoric has ratcheted up here the way it has elsewhere in the country, there are solid reasons for this. The situation is very different in New York City than it is in California and the Southwest.
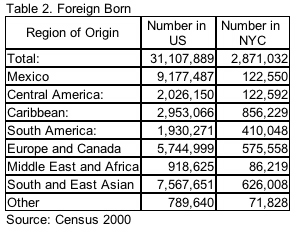
One difference is that the countries of origin in New York City are far more diverse than in other centers of immigration, as I wrote for this page in an article in 2002, "City of the Foreign Born." In Los Angeles, Mexicans account for almost 85 percent of the foreign born. No group in New York City is greater than 13 percent. So the protests in Los Angeles are largely that of one group. "The mobilization in New York City has been slower to develop," El Diario conceded recently. "The immigrant community here is incredibly diverse and, some say, harder to organize."
But the major difference may well be size and visibility of the undocumented. As of 2005, there are estimated to be 652,000 immigrants living illegally in New York City, which constitutes only about six percent of all of the undocumented in the United States. New York City's undocumented immigrants, as its legal immigrants, come from all continents and many countries of origin.
Jeffery Passel, a a leading analyst of immigrants, recently looked at the population of undocumented immigrants for a study by the Pew Hispanic Center. This study uses the so-called residual methodology, which makes it difficult to infer very much about the undocumented except their size. The study estimates that the number of undocumented immigrants in the United States may be 12 million by March 2006, and that they constitute about 30 percent of all immigrants nationwide. In New York City, the undocumented comprise only about 20 percent of all the immigrants here.
Two main groups of undocumented are those who entered the country without valid documents, including people crossing the Southwestern border clandestinely; and those who entered with valid visas but overstayed their visas' expiration or otherwise violated the terms of their admission. Most of New York City's undocumented belong to the latter category.
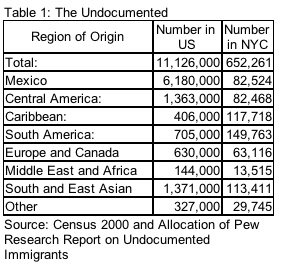
About 56 percent of unauthorized migrants in the United States come from Mexico. Another 22 percent of the total, come from the rest of Latin America, primarily from Central America. Between 2000 and 2005 the number of unauthorized migrants from Mexico increased by about 1.5 million. Other large increases occurred among unauthorized migrants from Central America (+465,000) and South and East Asia (+365,000).
New York City has many Asian immigrants. But, while the numbers are surely growing, there are still relatively few Mexicans or Central Americans here, compared to the West Coast.
The undocumented are more likely male. Many live in families and nearly two-thirds of their children were born in the United States and are citizens. Unauthorized workers are employed in a variety of occupations, although the distribution of the unauthorized workforce across occupations differs from that of native-born workers. For example, nearly a third of unauthorized workers were employed in service occupations compared to one-sixth of native workers. Unauthorized migrants are underrepresented in white-collar occupations. These facts are true of undocumented in New York City and throughout the United States.
Given the demographics of New York City, and its long-time political traditions, it seems likely that most New Yorkers will remain well disposed towards the city's immigrants, legal or illegal.
Andrew A. Beveridge has taught sociology at Queens College since 1981, done demographic analyses for the New York Times since 1993, and been in charge of Gotham Gazette's demographics topic page since 2000. The opinions expressed are his alone.Â


